Sales reports, whether daily sales or quarterly, have long been the go-to method for sales reps and managers.
A sales report can provide invaluable insights – but only if it’s effective and efficient.
Whether you’re a small business or a large enterprise, understanding your sales pipeline, meeting sales targets, and maximizing sales value requires a nuanced approach.
Our article aims to explore alternatives to traditional sales reporting templates, focusing on methods that can generate more effective sales reports and improve your monthly sales report and weekly sales report outputs.
What is a sales report?
A sales report is a comprehensive document that outlines the status of sales operations over a specific period, often generated by sales reps or managers.
It can range from daily to quarterly sales reports and is designed to track and analyze sales performance.
These reports often include metrics like:
- sales value
- average order value
- relevant sales KPIs
Together these help teams meet their sales targets. Whether you're using a free report template or the best sales report templates available. Sales reports serve as essential tools for monitoring sales activity and guiding sales operations.
Benefits of creating sales reports
Data-driven decision making
With accurate and comprehensive data at your fingertips, you can identify trends, assess performance, and make informed choices. By doing so, you can eliminate guesswork and get into strategic planning that is rooted in real-world metrics.
Performance monitoring and accountability
Sales reports serve as a performance monitoring tool for both individual sales reps and the entire sales team. By regularly tracking key metrics and comparing them against set objectives, team members can hold themselves accountable for their performance. This helps to build a culture of continuous improvement, and identifies areas where additional training or resources may be necessary.
Enhanced customer understanding
Sales reports often include customer-related metrics and feedback, providing valuable insights into customer behavior and preferences. If you fully understand your customer base, you can tailor your sales and marketing strategies to meet their needs better, ultimately leading to increased customer satisfaction and loyalty.
Financial planning and forecasting
Regular sales reporting aids in financial forecasting by providing a clear picture of revenue streams and sales trends. This is crucial for budget allocation, inventory management, and setting future sales targets. Accurate forecasting also helps in mitigating risks and capitalizing on market opportunities, so that the business is more resilient and competitive.
Who should use a sales report template
#1 Sales team members
Sales representatives and account managers are often the primary users of a sales report template. They input data on their sales activities, customer interactions, and achieved targets. A template helps them track their sales over time. It also serves as a tool for self-assessment and performance reviews.
#2 Sales managers and team leaders
Sales managers and team leaders use sales report templates to monitor the performance of individual team members as well as the team as a whole. Such a template provides them with a structured way to analyze key metrics, identify trends, and make data-driven decisions. It also helps in adjusting team targets, and in strategizing for upcoming campaigns.
#3 Executives and upper management
C-level executives may not have time to check daily sales activities, but they will require a summarized view of sales performance to make informed decisions.
A well-structured sales report template can provide them with quick insights into the health of the sales department and the company's revenue streams. Having this kind of helicopter view is crucial for long-term planning and resource allocation.
#4 Marketing teams
Marketing teams can benefit immensely from sales report templates. The data and insights from these reports can inform marketing strategies, helping to align marketing and sales goals. For example, understanding which products are selling well can help the marketing team focus their efforts on promoting those items.
#5 Financial analysts and stakeholders
Financial analysts within the company, as well as external stakeholders like investors, also find sales report templates useful. These reports offer a transparent view into the company's revenue generation capabilities, and enable assessment of both financial health and investment potential. When all the key data points are covered in the report, it is way easier to perform financial analysis.
Each of these groups has a unique need for sales data, and a well-designed sales report template can serve as a versatile tool to meet those needs.
What can be included in a sales report template

Executive summary
The executive summary provides a high-level overview of the sales performance for a specific period. It usually includes key highlights, such as total revenue generated, the number of new customers acquired, and any significant changes from previous periods. This section sets the tone for the rest of the report and gives readers an idea of what to expect.
Sales objectives and goals
This section outlines the sales targets that were set for the reporting period. It serves as a reference point for evaluating the team's performance. Objectives could range from increasing customer retention rates to expanding market share. Comparing actual results against these objectives gives insights into how well the team is doing.
Sales data
You can’t create a sales report without hard data. This section should include detailed information on sales revenue, product-wise sales, region-wise sales, and other relevant data. It often includes tables, charts, and graphs to make the data quick to evaluate, and easy to understand. This data serves as the basis for analysis and decision-making.
Sales metrics
Sales metrics go beyond raw data to provide a deeper understanding of sales performance. This could include key performance indicators like:
- Customer Lifetime Value (CLV),
- Customer Acquisition Cost (CAC),
- Sales Conversion Rates.
These metrics help in understanding the efficiency and effectiveness of the sales process.
Market analysis
This section should include information on market trends, competitor performance, and any changes in market regulations that could affect sales. Any information provided here will help the team adapt their strategies to meet changing market conditions.
Customer feedback and insights
The customer feedback section should summarize customer reviews, complaints, and suggestions collected during the reporting period. Insights derived from this feedback can make or break your future sales strategies.
Action plan and recommendations
This section outlines the action plan for the next reporting period based on gathered analysis and insights. It should include specific steps to improve performance, such as training programs for sales reps or changes in marketing strategies. Recommendations are aimed at helping the team meet or exceed future sales objectives.
Best practices for sales reporting

For individuals (a sales professional -> team)
#1 Regularly update CRM data
That CRM system you sometimes ignore? Time to make it your daily diary. Accurate entries here translate to a sales report that doesn't just look good but actually tells the real story. A well-maintained CRM can be your best ally during team meetings and performance reviews.
#2 Set personal KPIs
Forget the generic metrics that everyone's looking at. What are the numbers that tell your unique sales story? Maybe it's the number of repeat customers you've managed to maintain, or perhaps it's the upsells that you've nailed.
Make these your personal scoreboard and watch how the game changes. These personalized KPIs can also make you more valuable within your team.
#3 Use visual aids
Charts and graphs aren't just for the mathematically inclined. A well-placed pie chart can make your successes (and areas for improvement) pop off the page, catching the eye and making your point without a thousand words. Visuals can often reveal patterns that raw numbers can’t.
#4 Prioritize actionable insights
Data is a crucial element of a sales report. But you need to find a way to enhance it into something that you can use and transform it into actionable insights and an effective sales report. Maybe it's noticing that a particular approach has a higher close rate, or perhaps it's seeing a trend in customer questions that could lead to a new product feature. These insights can be the catalyst for innovative sales strategies.
#5 Be consistent
Consistency is the framework that holds your report together. Stick with the same metrics, layout, and timeframes so that everyone – yourself included – can easily compare every new report. Consistency also makes it easier to track your performance over time, providing a more accurate long-term view.
#6 Include customer feedback
Your customers are talking, but are you listening? Their feedback can be the secret ingredient in your sales strategy. They may love a feature you've overlooked, or perhaps they're asking for something that's easy to implement and could make a big difference. Including this feedback can also make your report a great resource for other departments like marketing and product development.
#7 Review and reflect
Sending out a report without reviewing it is a big mistake. Take a moment to digest what you've put together. What are the takeaways, and what are the next steps? Share these reflections with your team and discuss your varying opinions. It can often spark new ideas and strategies.
For teams (teams -> team sales leader)
#1 Aggregate team data
To make the most of your team’s data you need to look at it as a whole, not individual pieces. Aggregate the data to get a sense of how the team is performing as a whole. This collective view can reveal strengths and weaknesses that aren't apparent at the individual level. It's a holistic approach that can inform both individual coaching and team strategy.
#2 Set team benchmarks
Benchmarks are your team's collective goals. They should be challenging yet achievable, inspiring yet grounded. And remember, these aren't set in stone – they can be adjusted as market conditions change.Benchmarks also serve as a motivational tool, giving the team something tangible to strive for.
#3 Use real-time dashboards
This works as a pulse check on your team's performance at all times. It's not just about the numbers – it's about the trends, the sudden spikes or drops, the unexpected outliers that could signal something worth digging into. That real-time data can be a game-changer in fast-moving sales environments, allowing for quick pivots and decisions.
#4 Segment sales data
Segmentation lets you see the details within your data. Maybe one product is performing exceptionally well in a specific region, or maybe a particular sales approach is resonating with a certain demographic? You won’t know that without checking the data. With these insights, you can guide targeted strategies that yield better results. Segmentation can also help in allocating resources more efficiently.
#5 Foster open communication
Open communication keeps the team machine running smoothly. Whether it's a quick morning huddle or a dedicated weekly meeting, creating spaces where team members can share insights, ask questions, and offer feedback is crucial for ongoing improvement. It also fosters a culture of transparency and collaboration, making the team stronger as a whole.
#6 Regular team reviews
Think of these as your pit stops in the sales race. It's your chance to refuel, make necessary adjustments, and get back out there. Use this time to not only review the numbers but also to celebrate the wins and strategize on how to overcome challenges. These reviews can also serve as a forum for brainstorming and sharing best practices.
#7 Leverage technology
Tech tools aren't just for the IT department. They can help your entire team in creating efficient and insightful sales reports. From automated data collection to advanced analytics, the right technology can save you time and provide deeper insights. Embracing tech can give your team a competitive edge in a tech-driven marketplace, apart from making a quarterly sales report easier to create.
For sales managers (managers -> stakeholders)
#1 Align with business objectives
Your sales goals shouldn't be floating in a vacuum. They need to be tightly aligned with the company's broader objectives. This alignment ensures that everyone – from sales reps to stakeholders – is pulling in the same direction. It also makes it easier to secure buy-in and resources for your initiatives.
#2 Provide executive summaries
Time is money, especially for busy executives. An executive summary at the top of your report can deliver the key takeaways in a bite-sized format, making it easier for stakeholders to understand the big picture without getting lost in the details. It's also a sign of respect for their time, which can go a long way in building rapport.
#3 Use predictive analytics
Predictive analytics are your crystal ball, offering a glimpse into future sales trends. While it's not 100% accurate, it's a valuable tool for planning and decision-making, helping you to allocate resources more effectively. It also adds an extra layer of sophistication to your sales reporting template.
#4 Include ROI metrics
ROI metrics translate your team's efforts into the language of dollars and cents, providing a clear picture of what you're bringing to the table. It's not just about revenue – it's about profitability, customer acquisition costs, and lifetime value. These metrics can also help in future planning and resource allocation.
#5 Be transparent
Honesty is the best policy, especially in sales reporting. Share both the triumphs and the setbacks. This balanced view offers a realistic picture of where the team stands and what needs to be done to move forward. Transparency also builds trust, making it easier to navigate challenges and celebrate successes together.
#6 Customize for stakeholders
Customize your reports to highlight what's most important to each stakeholder group. Focusing on long-term growth for investors or drilling down into quarterly numbers for department heads, a tailored approach makes your report more effective. Customization shows that you understand and value the unique perspectives of different stakeholders.
#7 Schedule regular updates
Keep the lines of communication open with regular updates. Whether it's a monthly briefing or a quarterly deep-dive, these scheduled check-ins keep everyone informed and engaged, making it easier to secure buy-in for your strategies and initiatives. Regular updates also provide a structured framework for tracking progress and making necessary adjustments.
Try Capsule CRM free for 14 daysGet started
Sales report template: five examples
Below, you will find some sales reporting template examples. They are ready-to-use, but feel free to customize them to your needs when you see fit.
#1 Daily sales report template
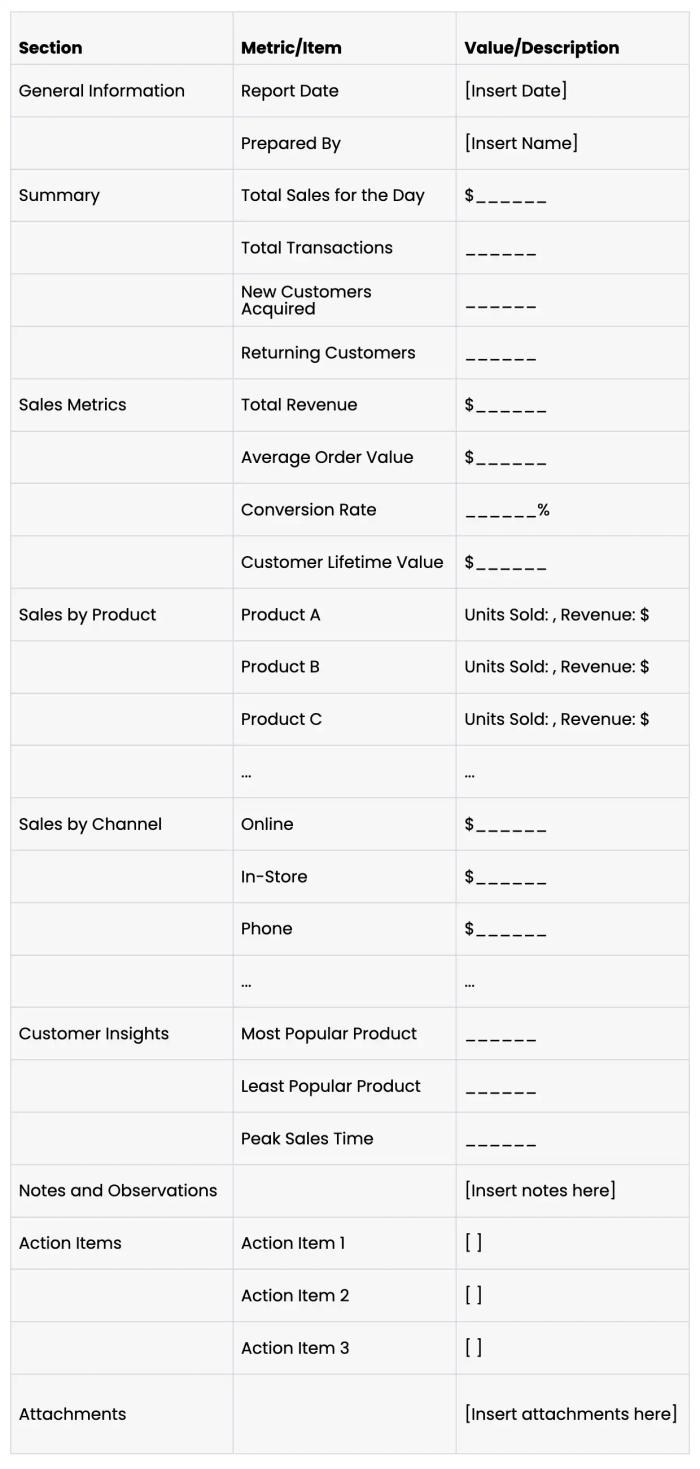
A Daily sales report template offers a granular view of sales data within a 24-hour period. This focus on immediate, day-to-day sales data makes it essential for quick decision-making and is distinct from weekly sales reports or monthly sales reports.
#2 Weekly sales report template
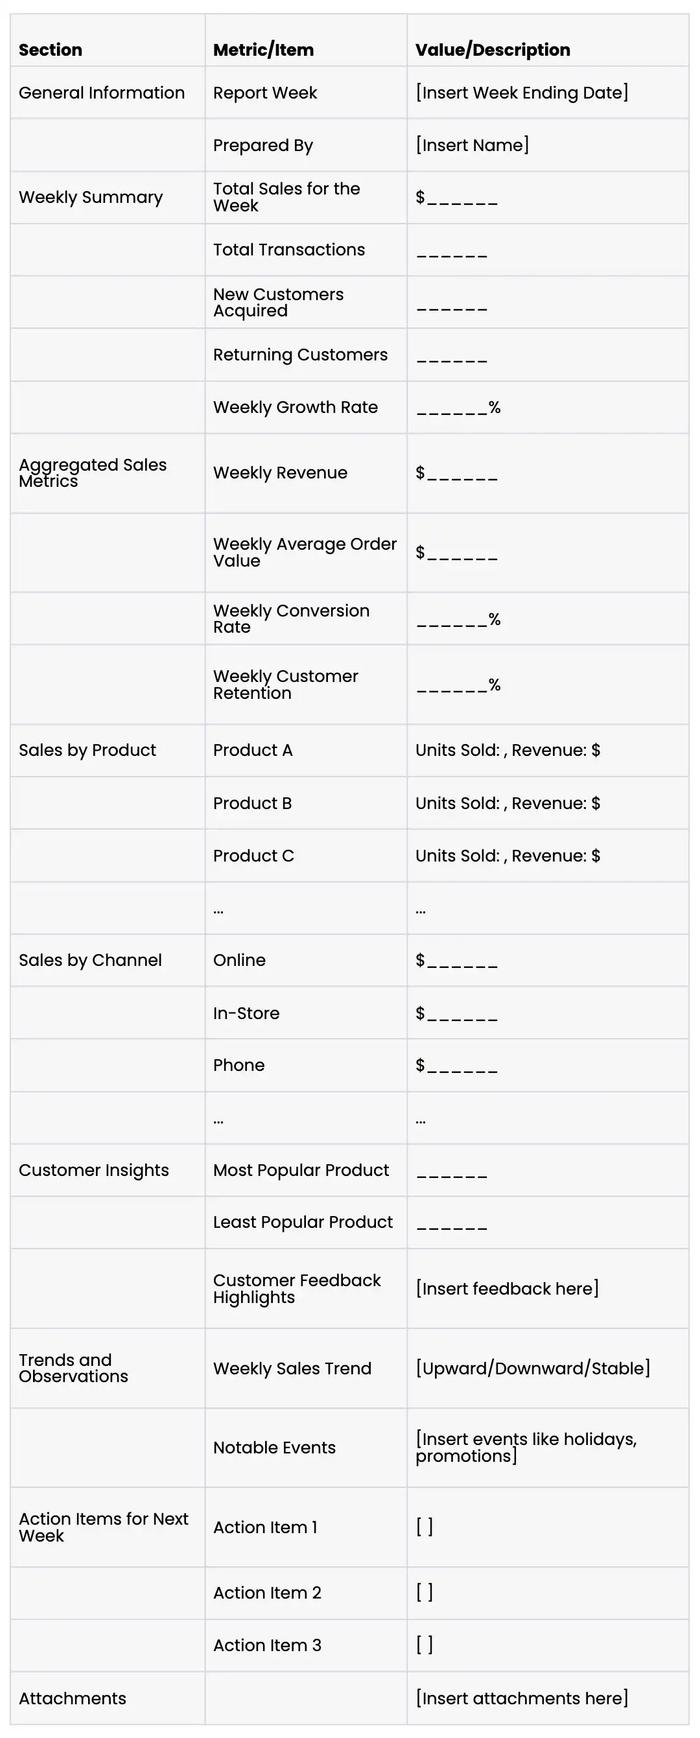
The weekly sales report template provides an aggregated look at sales data and sales performance over a seven-day period. Unlike a daily sales report, it includes weekly-specific metrics like Weekly Growth Rate allowing for a broader understanding of short-term sales trends and sales growth.
#3 Monthly sales report template
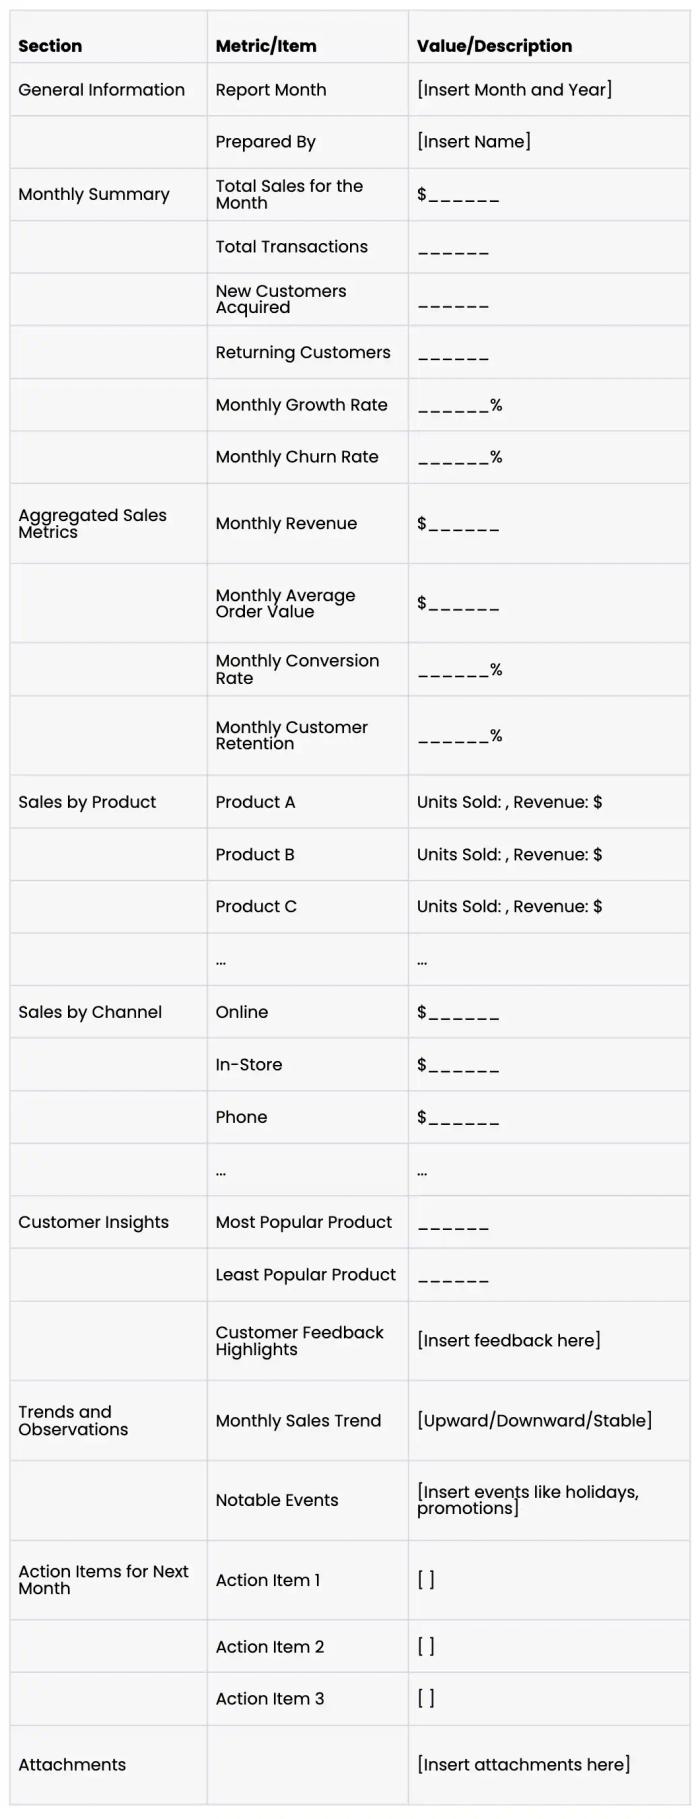
A monthly sales report template gives you a comprehensive overview of sales operations and sales revenue over the course of a month. Incorporating monthly-specific metrics such as Monthly Growth Rate and Monthly Churn Rate it stands out for monthly planning and sales analysis report needs.
#4 Yearly sales report template
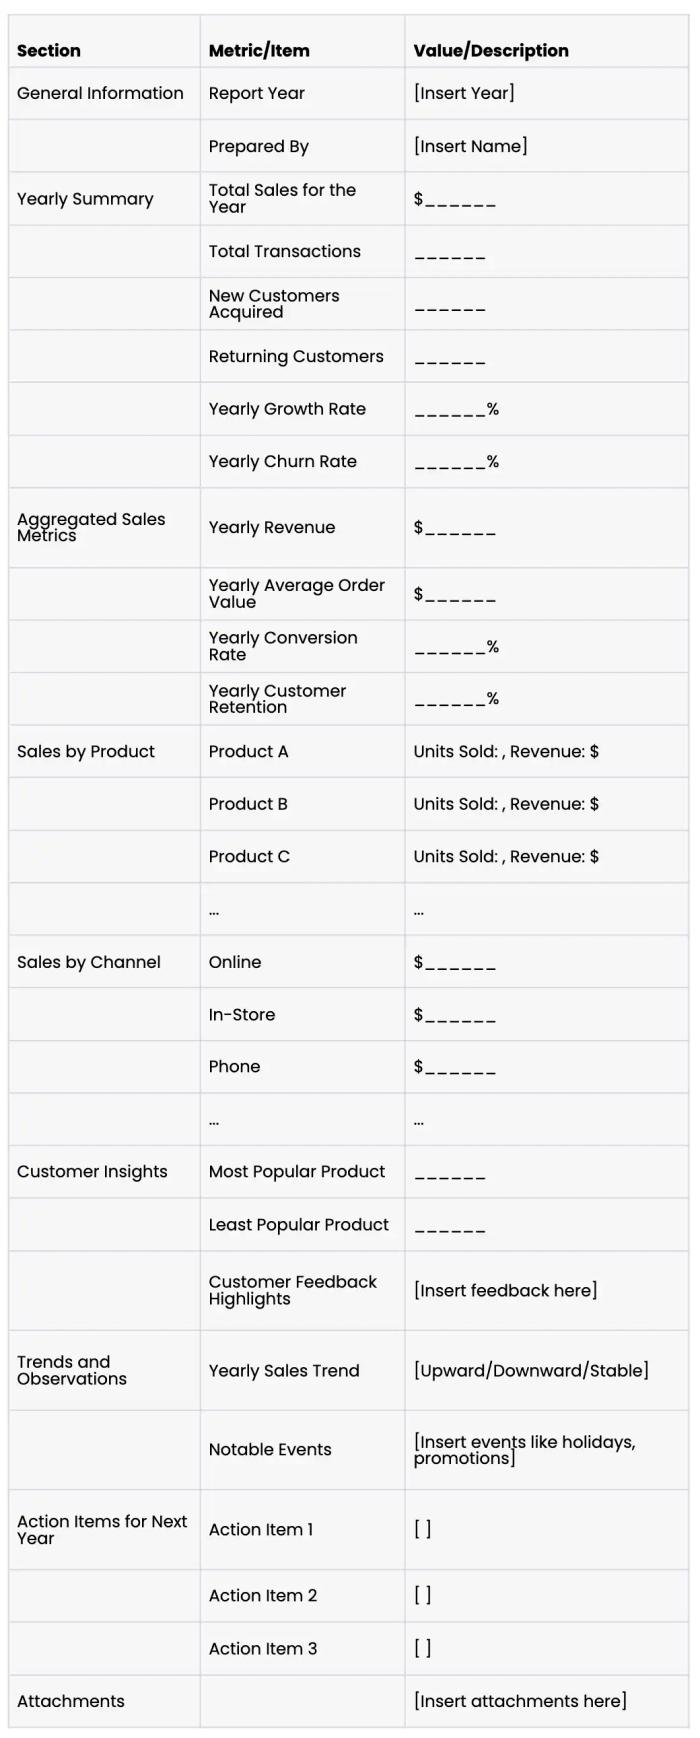
The yearly sales report Template is unique in offering yearly metrics like "Yearly Growth Rate." It creates a high level summary of a year’s worth of sales data. These metrics can navigate long-term strategic planning and differ from what you'd find in quarterly sales reports.
#5 Team sales report template
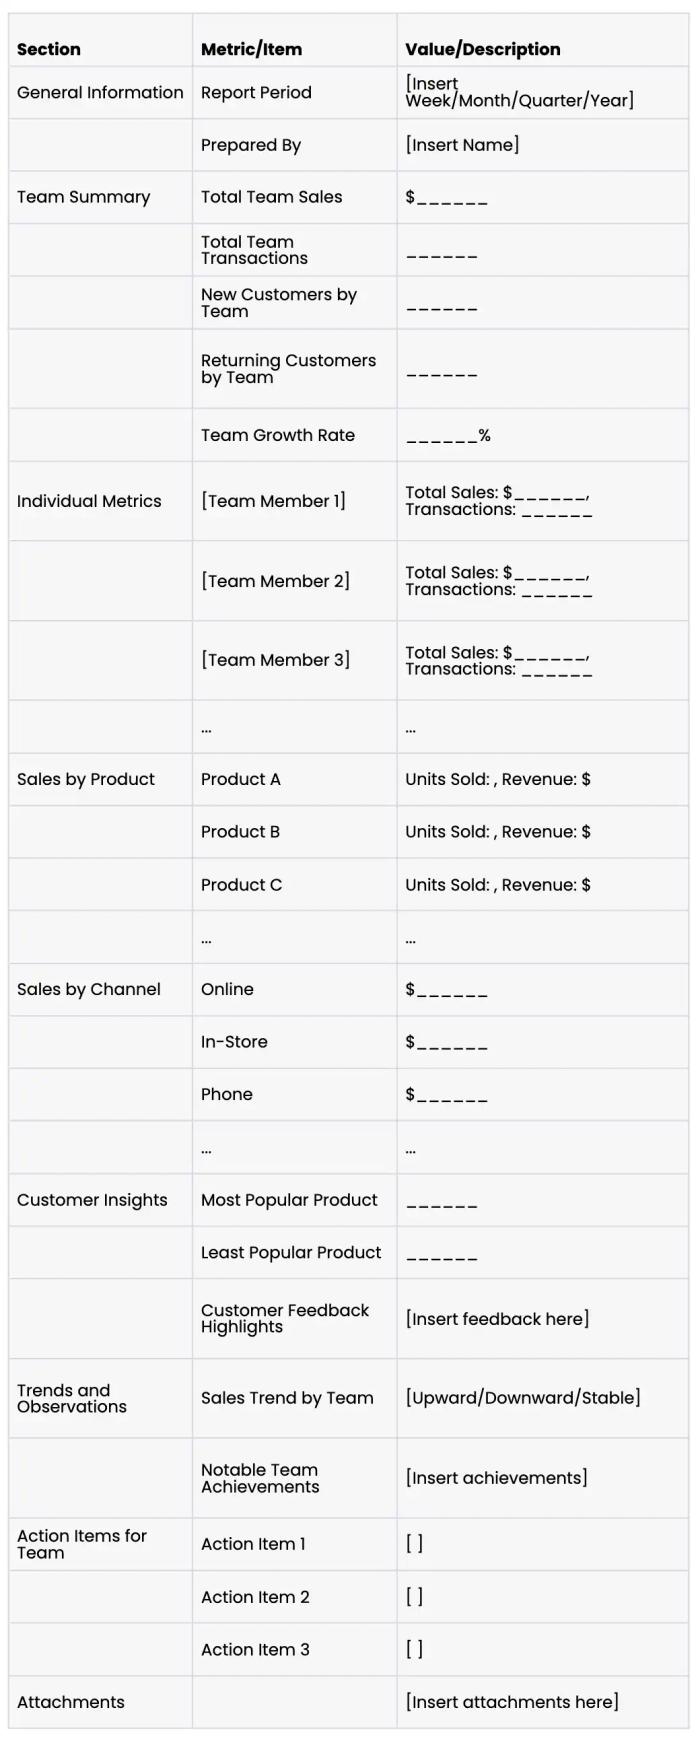
This template focuses on the sales team's performance metrics and is helpful for managing sales teams and sales efforts. It emphasizes team dynamics and individual contributions, making it distinct from other sales report templates that focus solely on sales revenue or sales volume.
What to use instead of sales reports
While sales reports are awesome tools for analyzing data and tracking sales performance, they are not the only resources available for gaining insights into your sales operations. There are alternative methods and tools that can offer a more dynamic, real-time view of sales data, thereby enhancing your sales process and future performance.

Customer Relationship Management (CRM) systems
One of the most effective alternatives to traditional sales reports is the use of Customer Relationship Management (CRM) systems. Unlike static daily, weekly, or monthly sales reports, CRM platforms offer real-time data and a lot of features that can help you improve sales operations and sales efforts.
CRM systems are designed to manage and analyze customer interactions throughout the entire sales process. They help sales teams track leads as they move through the sales funnel, from initial contact to conversion. This real-time tracking can be particularly useful for sales reps who need to prioritize their efforts based on lead to opportunity ratio or other relevant metrics.
Sales dashboards
Another alternative to using sales report templates is the implementation of sales dashboards. These dashboards can present data in a more interactive and real-time manner.
They are excellent tools for monitoring sales targets, sales value, and even sales rep performance. Dashboards are particularly useful for sales teams that need to make quick decisions based on current data. You can build sales dashboards within CRM software too.
Predictive analytics and sales forecasts
Predictive analytics tools take past and current sales data into account to forecast future performance. These tools go beyond the capabilities of a simple sales report presentation, offering predictive models that can guide sales teams in setting realistic sales targets and optimizing their sales pipeline.
Automated sales reporting tools
Automated sales reporting tools can create sales reports that are more dynamic and customizable than traditional excel sales report templates. These tools can automatically pull in data from various sources, allowing for a more comprehensive sales analysis report sample. They can be programmed to generate daily sales reports, weekly sales reports, or even important quarterly sales reports, depending on your needs.
Key performance indicators (KPIs)
Sales reports often cover standard metrics, but focusing on relevant sales KPIs can offer a more nuanced view of your sales team performance. KPIs can include metrics like average order value, average purchase value, and profit margin, which are often not covered in free sales report templates.
The best tool for your sales reporting needs will depend on various factors, including the size of your sales team, the complexity of your sales process, and the specific challenges you face in your sales industry.
For small businesses, a free sales report might suffice. However, as your operations grow, you may find that you need more advanced tools to keep track of your sales growth and sales value.
Sales reporting myths debunked
Here are three common misconceptions about sales reports:
Myth 1: Sales reports are only for managers.
Sales reports aren’t just for management oversight – they are a vital tool for sales reps too. Reps who analyze their own performance can identify trends, improve their sales strategy, and adjust tactics to hit targets. As a result, they are empowered to take responsibility for their results.
Myth 2: Sales reports only show past performance.
While sales reports do provide insight into past sales revenue, they can also help forecast future performance. Sales pipeline data – along with predictive analytics – can guide decision-making and show potential trends, helping businesses plan and adjust strategies in real-time.
Myth 3: Reporting tools are too complex for small businesses.
Many small businesses avoid sales reports – thinking the tools are too complicated. In reality, there are CRM tools and sales reporting systems that are simple and intuitive, designed for startups and smaller teams. These tools provide just the right level of detail to help businesses track progress and improve efficiency without being overwhelmed by complexity.
Conclusion
While traditional sales reports, whether they be daily, weekly, or monthly sales report templates, have their place in tracking sales performance, they are far from the only tools available. From CRM systems to predictive analytics, there are numerous ways to gain a more comprehensive understanding of your sales operations.
Choosing the right sales report template or alternative method, you can better meet your sales targets, optimize your sales pipeline, and ultimately generate a more successful sales report.
Try Capsule CRM free for 14 days and see how it can help you manage your sales team.
Sales report FAQ
How do you write a sales report?
To write a sales report, gather all relevant sales data and metrics for the reporting period, then organize them into sections like executive summary, sales data, and action plans. Use charts and graphs to visualize data for easier interpretation.
How do I create a sales report template?
To create a sales report template, outline the key sections you'll need and move them to a tool or method of your choice. You can go for a simple Excel template, build a report in Airtable, or use CRM to analyze and report data on the go.
How do I send a daily sales report in Excel?
To send a daily sales report in Excel, first ensure all data and metrics are updated for the day. Save the Excel file and attach it to an email, or use Excel's "Share" feature to send it directly to the recipients.
How do I create a sales report template in Excel?
To create a sales report template in Excel, use Excel's built-in features like tables, charts, and pivot tables to set up sections for key metrics and data. Save this layout as a template (.xltx) for future use.
What are relevant sales KPIs?
Sales Key Performance Indicators (KPIs) are crucial metrics that help businesses gauge the effectiveness of their sales efforts. Some of the most relevant sales KPIs include revenue growth rate, customer acquisition cost, customer lifetime value, sales volume, and conversion rates, among others.


