
Only 39% of business leaders say their company's decision-making is highly data-driven. Another 8% admit it's rarely data-driven at all. Yet by 2026, data-driven strategies are projected to outperform gut feelings in 65% of B2B sales organizations.
That gap is where small and mid-sized companies either pull ahead or get left behind.
The businesses that already analyze their sales data systematically are forecasting more accurately and noticing problems while they're still fixable. The businesses that don't, are running on instinct, which works… until it doesn't.
This guide is about closing that gap with no need to build a data team. It covers what sales data matters for a small or mid-sized company and how to turn the answers into changes the sales team can act on. It's written for owners and sales managers who want to start analyzing, here and now.
What is sales data analysis?
Sales data analysis is the practice of pulling structured information about how the company sells, examining patterns in that information, and using what comes out to make better decisions.
That definition sounds dry; the reality is more practical. Sales data analysis answers questions the business needs to answer to grow, like:
- Which customers are worth more attention, and which are quietly costing money to serve?
- Where do deals stall in the pipeline, and which stages are leaking?
- Which products generate the most profit per hour of sales effort?
- What does the next quarter realistically look like, based on what's already in motion?
A small company that can answer those four questions reliably is operating on a different level than one that can't. The difference is the discipline of looking at the data on a regular cadence and acting on what it shows.
Where sales data lives in a small or mid-sized business
The first practical question isn't "how do I analyze sales data?" but "where is my sales data right now, and what shape is it in?" For a typical company under a hundred people, the answer is a mix of three sources.
The CRM holds the relationship and pipeline data
The customer relationship management system is where contact records, deal pipelines, sales activity, and communication history live. If the CRM is well-maintained, it's the single richest source of sales data the company has.

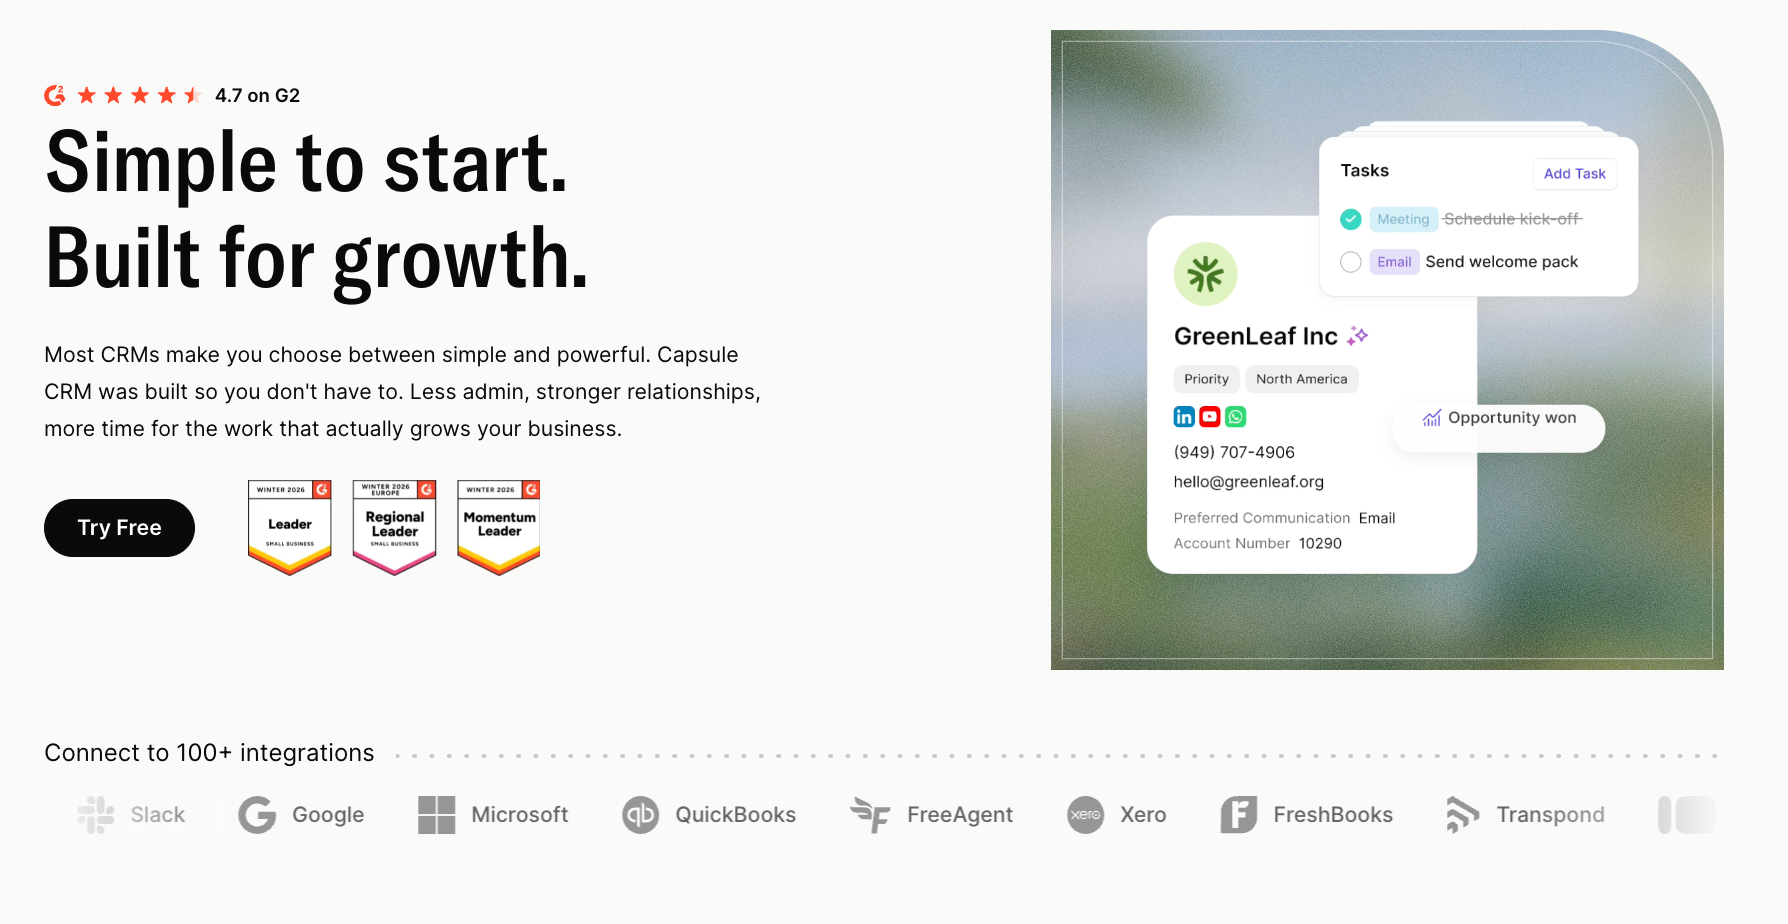
Capsule CRM holds this for many small businesses, including pipeline stages, deal values, contact history, and the activity log of who reached out to whom and when.
Can the owner pull a report showing every deal that closed in the last quarter, with deal value, stage progression, and the salesperson involved?
If yes, the CRM is doing its job.
If not, the CRM needs cleanup before analysis can start.
The accounting system holds the revenue and margin data
QuickBooks, Xero, or whatever the business uses for invoicing and bookkeeping holds the actual money side of sales. Invoices sent, payments received, days outstanding, revenue by customer, gross margin by product. The CRM might say a deal closed at $5,000, but the accounting system says how much of that actually arrived and when.
For analysis that touches profitability, both systems have to be looked at together. CRM data alone overcounts revenue because it doesn't see write-offs and discounts. Accounting data alone under-tells the story because it doesn't see what's in the pipeline.
Spreadsheets hold everything else
Almost every small business has a parallel layer of sales data in spreadsheets. Forecast tabs, commission tracking, win/loss notes, and custom reports. Some of this is legitimate. Most of it is a workaround for things the CRM or accounting system doesn't do natively.
The spreadsheet layer is usually where analysis hits its first real wall. Different people use different sheets, and version control gets lost fast. Cleaning up this layer, or moving the most important parts of it into the CRM, is often the highest-leverage thing a company can do before serious analysis starts.
The five sales metrics for small businesses
A small or mid-sized business doesn't need fifty metrics – It needs five it can read reliably and act on. The right five depend on the business, but for most companies, the list below covers what matters.
#1 Revenue by customer segment
Total revenue is the headline number. Revenue broken down by customer segment shows where it's coming from. Segments can be defined by industry and company size, or by product line, depending on what the business serves.
The pattern that almost always emerges: revenue concentration is heavier than the owner thinks. A handful of segments produce the majority of revenue, and a handful of others contribute almost nothing despite consuming sales attention.
#2 Average deal size and how it's trending
The average deal size today, compared to the average twelve months ago, tells the business if it's moving upmarket or downmarket. Declining average deal size with rising deal count usually signals a shift toward smaller customers, which has real implications for margin and operational load.
#3 Sales cycle length
How long does a deal take from first contact to closed-won? This number is one of the most underused metrics in small business sales analysis. A lengthening sales cycle is an early warning that something is changing, like market conditions or the kind of prospects entering the pipeline.
#4 Pipeline conversion rate by stage
A pipeline that runs through five or six named stages can be analyzed at every step. What percentage of deals at the "qualified" stage advance to "proposal sent"? What percentage of proposals turn into closed-won? The stage where conversion drops most sharply is the stage that needs attention.
Most struggling sales processes have one or two leak points doing disproportionate damage, and pipeline conversion analysis is how the business finds them.
#5 Win rate by source
Not all leads convert equally. Referrals usually close at meaningfully higher rates than cold inbound, and inbound from organic search often closes better than paid ads. Tracking win rate by lead source tells the company where to double down on marketing spend and where to scale back.
How to run a sales data analysis
The hardest part of sales data analysis for small companies isn't the math. It's building a habit of doing it consistently, on a fixed cadence, with action items that come out of it.
Start with a single question
The most common mistake in early sales data analysis is trying to build a comprehensive dashboard before answering anything specific. Dashboards take weeks to set up properly and rarely change what anyone actually does.
Pick one question that's been nagging the business. Something like "why did revenue dip last quarter," or "which customers are most likely to churn", or even "which deals are stalling." Pull the data needed to answer just that question. Get an answer, act on it, then pick the next question.
Dashboards come later, once the company knows what it wants to look at every week.
Pick a fixed cadence and stick to it
Sales data analysis only generates value when it happens regularly. A monthly pipeline review on the first day of every month is more valuable than a sophisticated one-time analysis nobody repeats.
A practical small-business cadence:
- Weekly → pipeline review, focusing on stalled deals and stage movement
- Monthly → revenue by segment, win rate by source, sales cycle trend
- Quarterly → customer profitability deep dive, churn analysis, year-over-year comparisons
The rhythm matters more than the depth. A team that runs through the same five metrics every Monday morning will catch problems months earlier than a team that runs a once-a-year deep dive.
Use the CRM's native reporting first
Before reaching for a separate BI tool, look at what the CRM can already do. Capsule's sales analytics covers most of what a small or mid-sized business needs for pipeline reporting and conversion analysis. The reports show pipeline value at each stage and win rates, with revenue grouped by tag or custom field.

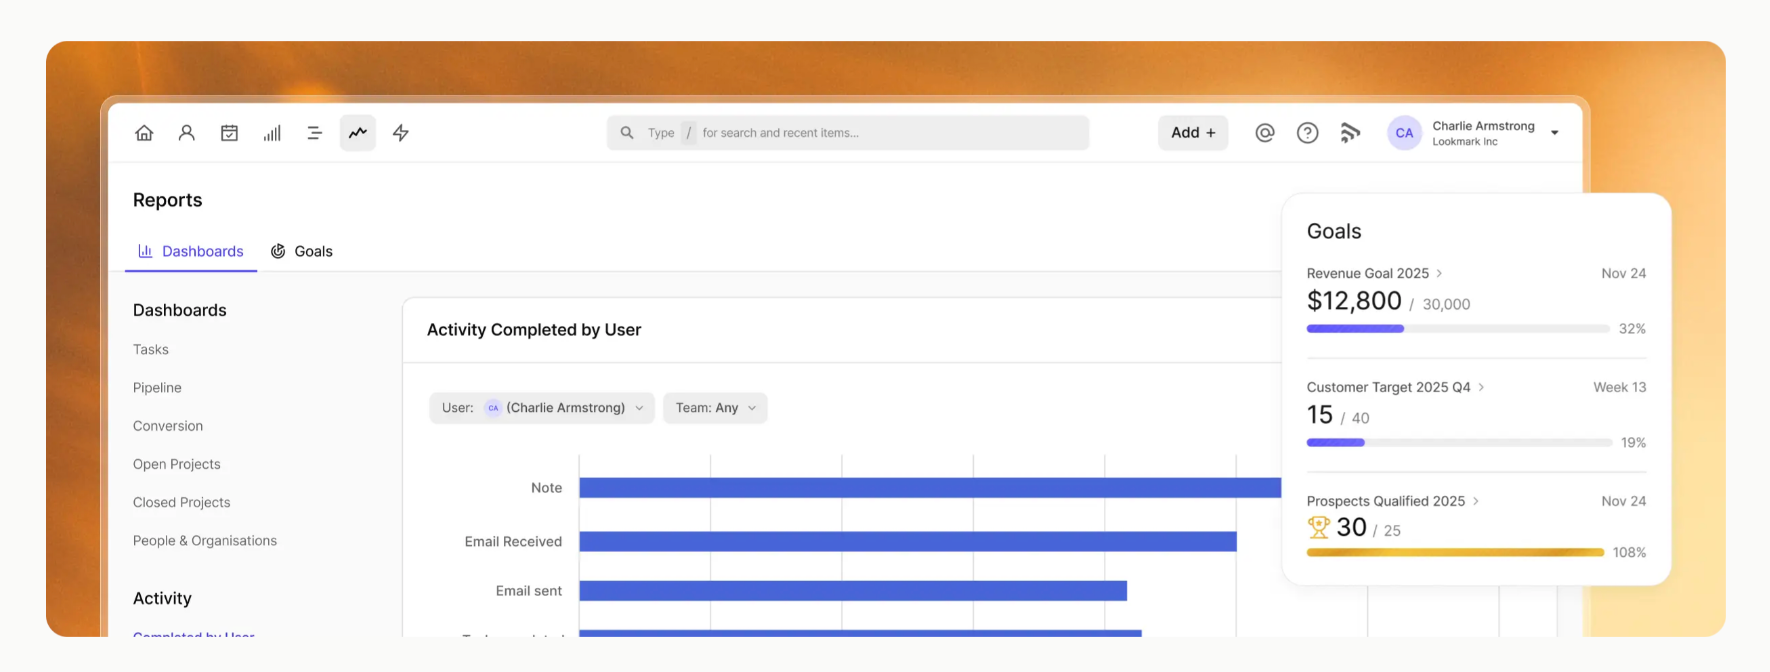
The advantage of using the CRM's native reporting is that the data is already there. No exports, no reconciliation, no version-of-truth disputes. The disadvantage is that more complex analyses involving accounting data or external sources need a different tool. A real time API can help teams enrich sales reports with fresh external business data, making lead lists, market insights, and CRM analysis easier to keep current.
Most small companies can get the majority of the analysis they actually act on from native CRM reporting. Anything beyond that can usually wait until the business has outgrown what the CRM already provides.
Build segments and tags into the CRM from the start
Good sales analysis depends on good segmentation, and segmentation starts with how contacts and deals are tagged in the CRM. Capsule's tagging and custom fields make this work for small businesses, with custom fields capturing things like industry and company size, or lead source by channel.

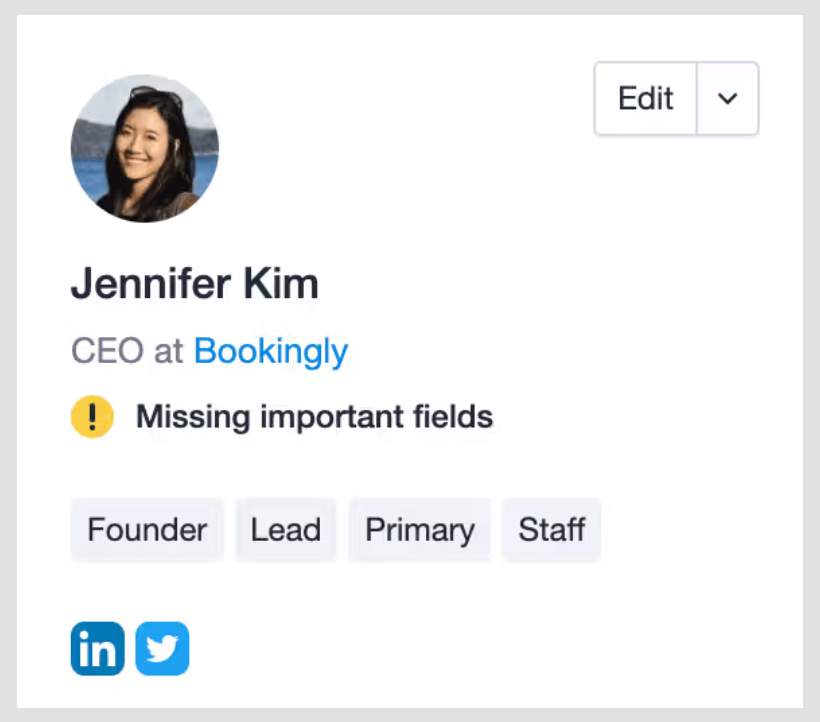
Discipline matters more than the tool. A CRM with consistently tagged contacts produces analysis you can actually trust. A CRM where tagging is incomplete or inconsistent produces analysis that can easily mislead you.
Often, the owner’s most valuable sales data investment is the unglamorous work of getting the tagging right.
How AI changes sales data analysis for small businesses
Until recently, meaningful sales data analysis required either a dedicated analyst or hours of the owner's time every week. Fortunately for SMBs, that ceiling has shifted. AI features built into modern CRM platforms now do significant chunks of the work that used to require manual effort.

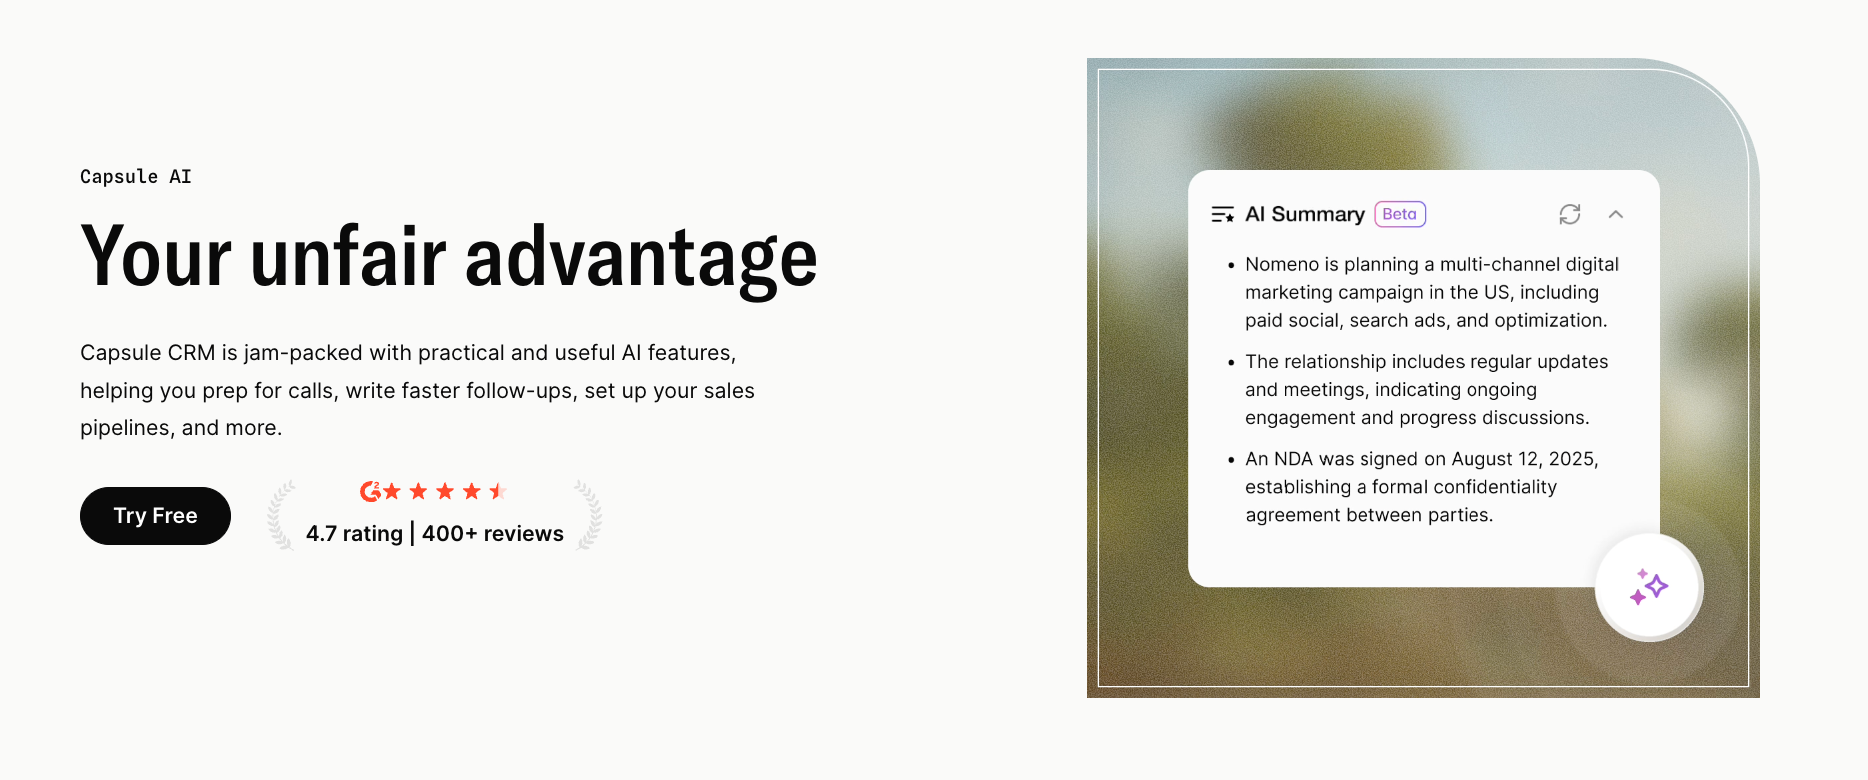
Capsule's AI features cover three uses that matter most for small business sales analysis:
- AI Summaries condense long contact histories or deal records into brief summaries that highlight what's actually happened and where things stand. A sales manager preparing for a pipeline review can read AI-generated summaries of stalled deals in minutes instead of reconstructing each one from the activity log.
- AI Pipeline Generator builds a starter pipeline structure from a description of how the business sells. Businesses that have never translated their sales process into formal stages can use this to replace days of workshop time with a focused thirty-minute exercise.
- AI Content Assistant drafts follow-up emails, proposal outlines, and contact updates based on the relationship history in the CRM. The time savings translate directly into more sales activity, which in turn produces more data to analyze.

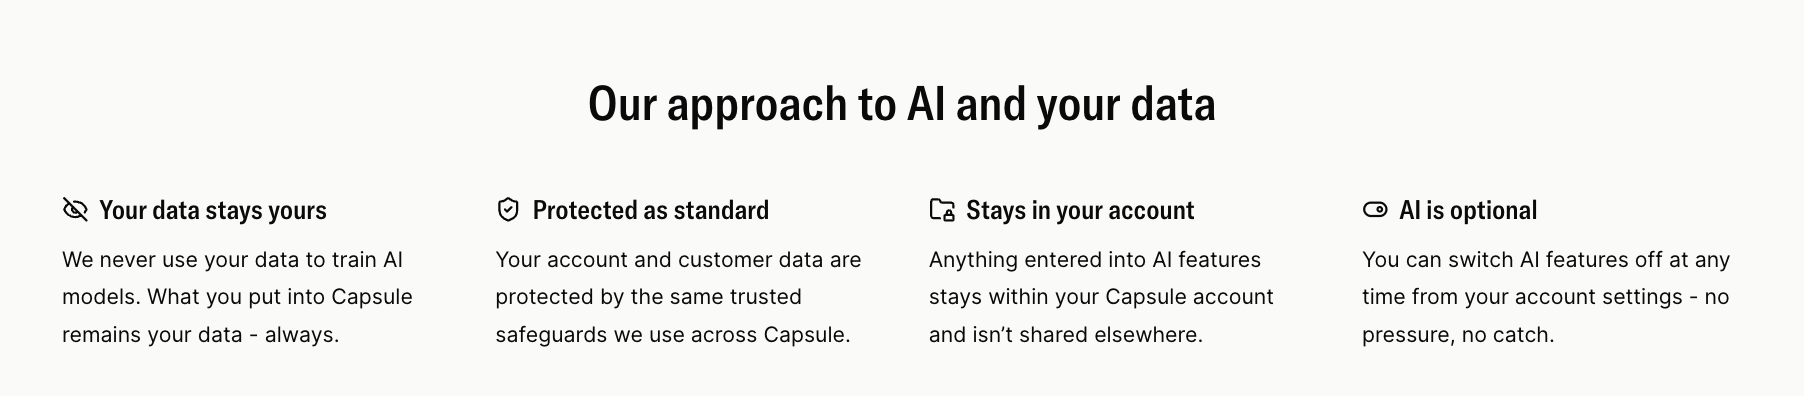
AI doesn't replace sales judgment. It removes the friction that used to keep small businesses from analyzing their sales data in the first place.
How to turn sales data insights into business decisions
The analysis itself is the easy part. The hard part is converting what the data says into changes the company actually makes. Many sales analyses end with a clear insight and no follow-through, which is the same as not having analyzed anything at all.
The gap closes when analysis ends with a small number of clear decisions. After each review cycle, weekly or monthly depending on the business, the team picks actions supported by the data. Two at most, prioritized by impact and ease of execution.
Each decision gets an owner, a deadline, and a measurable expected outcome.
If the data shows that referral leads convert at twice the rate of paid leads, the decision might be "shift 30% of paid spend into a referral program by next month, measured by referral count and conversion."
If pipeline conversion drops sharply between qualified and proposal, the decision might be "rebuild the qualified-to-proposal handoff script by Friday, measured by next month's conversion rate at that stage."
The next analysis cadence opens with a check: did the previous decisions get made, and did the expected outcome materialize? This is what separates teams that use sales data from teams that just produce sales reports.
Build a short feedback loop
Sales data analysis becomes valuable when it shortens the time between noticing a problem and fixing it. A pipeline review that catches a stalled stage on Thursday and produces a fix by Friday is worth more than a deep quarterly review that catches the same issue three months later.
Short feedback loops also build the team's confidence in the data. When a salesperson sees that last week's pipeline review actually changed how the manager allocates support, they pay more attention to the data going in. Bad data hygiene fixes itself when the team can see the data being used.
Resist the urge to overhaul everything at once
The typical failure mode is overreach. A detailed sales analysis shows several possible improvements, the owner tries to act on all of them at once, and the team executes none of them well. Internally, the analysis starts to feel like noise.
The discipline is to pick the one or two changes with the highest expected impact, implement them well, measure the result, and then move on to the next round. This is slower than a wholesale overhaul, but it's the only approach that actually compounds over time.
Common mistakes in small business sales data analysis
A few mistakes show up consistently in sales data analysis at small and mid-sized companies. The good news is that all of them are fixable once recognized.
#1 Measuring activity instead of outcomes
Counting calls made and emails sent is easy. Measuring if any of that activity produces revenue is harder, and that's the measurement that moves the needle. A sales team hitting all its activity targets while missing its revenue targets has an activity problem that more activity won't fix.
#2 Confusing correlation with causation
Two metrics moving together doesn't mean one is causing the other. Revenue went up in the quarter the company added a new product, but it also went up in the quarter the company hired a new salesperson and ran a referral campaign. With no isolation of variables, analysis produces confident-sounding conclusions that are actually guesses.
#3 Ignoring the quality of the underlying data
Garbage in, garbage out applies to sales data more than almost anywhere. Analysis built on a CRM where deal values are guessed, and stages are inconsistently applied, produces conclusions that look authoritative but aren't. The first investment in sales data analysis is usually in data quality.
#4 Building reports nobody reads
The most elaborate sales dashboard is useless if it's not actually informing decisions. Before building any new report, the practical test: who reads it, when, and what action does it trigger? Reports that fail that test get cut; the remaining reports get more attention.
What better sales data analysis changes in the business
Sales data analysis earns its keep when it changes how decisions get made.
In a small or mid-sized business, that change is visible quickly. Forecasts become easier to trust because pipeline risk shows up earlier. Pricing decisions become easier to defend because the business can see which segments are more price-sensitive. And then, hiring becomes more targeted because the company can identify where sales coverage is actually missing.
The business starts operating with less uncertainty. Judgment still matters, but it is grounded in what the sales data shows, not memory, anecdotes, or the loudest opinion in the room.
Capsule CRM gives small businesses a simple way to build that discipline, with native sales reporting and AI features that reduce manual work. The free plan includes two users and 250 contacts, so teams can start bringing structure to their sales analysis without adding another monthly cost.