Better insights lead to a better understanding of your business and even better interactions with your prospects and customers. Our latest activity and sales report enhancements allow you to drill down into activity and sales data, making it easier to monitor your sales opportunities and customer relationship activities.
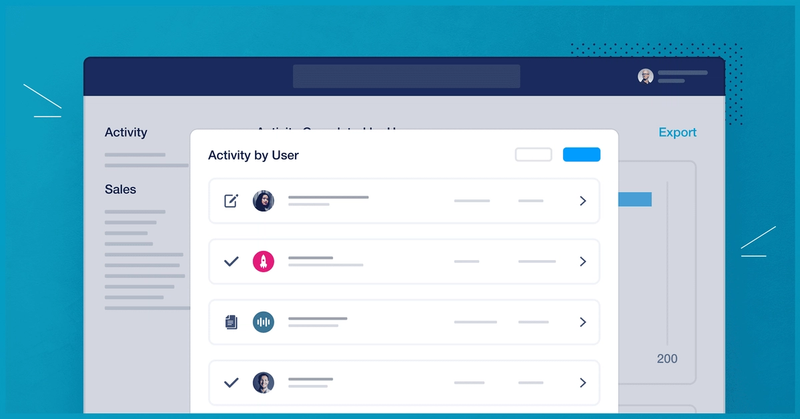
You can now see a breakdown of any activity or sales report by clicking on the bars of the charts or clicking the rows in the tables. These can all be easily exported for external reporting.
Each of the reports can be filtered by date, providing a clear snapshot of activity carried out in a specific period. Filter reports to focus on a particular quarter, month, week or a customized timeframe.
Let’s take a look at what reports contain the breakdowns, how the report breakdowns have expanded the reporting functionality and some examples of how this can be useful.
Performance Management
Use the Activity Completed by User/Type reports to see exactly what activities are being completed by different users and the number of those activities. The report breakdown gives a really easy way to see if people are reaching activity quotas that are set out for them or completing specific activities related to sales opportunities.
If you have someone new on your team, you’ll not only be able to see which types of activities they’re completing, but you’ll be able to dive down and make sure their outreach fits your company’s usual approach and notice any areas they’re struggling with - helping to diagnose any training gaps and strengthening your company’s onboarding process.
You can also filter the report to show specific users and/or teams. If you only want some activities appearing on the report you can toggle these on and off by clicking on the activity name on the right-hand side of the chart.
Performance management
Lead Conversion
There are 3 reports in the Won/Lost Opportunity series. These reports show you the number or value of won and lost opportunities, over time, by team or by owner. The reports can be extremely useful when trying to spot trends, such as which team member is converting the most leads and what is the most successful month.
The report breakdown makes this data even more effective as you can see exactly which sales opportunities have contributed to the total of won or lost opportunities.
Let’s say you had a particularly good month in June and want to investigate why this was. You can click on the won opportunities for June and see all the opportunities that were won that month, when they were won, by whom and which team they are in. From there you can click directly on the opportunity to see which activities contributed to that being a successful sales opportunity.
Lead conversion
Lost Opportunities
The Lost Opportunities reports allow you to see the lost opportunities on their own split out by owner, team or reason. This allows you to spot if a certain team or user is losing more opportunities than normal and drilling down into them you can see exactly which ones they were.
The lost reasons report is particularly useful when diagnosing why opportunities are being lost. Let’s say you have quite a significant number of opportunities being attributed to the price being too high, you can click on that reason in the chart or table and see those exact opportunities. Perhaps you’ll find that the organizations were wrongly qualified which is why they found the price too high.
Lost opportunities
Pipeline Insights
The 8 reports relating to the pipeline allow you to easily dig deeper into your pipeline and forecast sales.
The Leaking Pipeline report for example allows you to spot at which stage in the pipeline opportunities are being lost and where you might need to focus your attention to fix that.
The Pipeline by Owner/Team reports let you see what people are up to easily and the Pipeline by Milestone report is a great way to identify at which stage sales opportunities might be being held up.
Another report that can help with this is the Average Time to Won report, so you can see how long a won sales opportunity has spent at each stage in your sales pipeline.
Capsule customers like HASBEAN have found the Sales Forecasting report to be particularly helpful in accurately predicting sales and planning for the future.
Pipeline insights
As you can see there are several uses for the reports from analysing team performance to diagnosing problems in your sales process. The report breakdowns take this one step further allowing you to connect the dots and get real actionable insights.
To learn more about these updates and their availability here's a quick guide.


