Capsule now includes a set of individual dashboards that give you greater visibility into your data across key areas like tasks, pipeline, conversions, projects, and contacts. These dashboards make it easier to spot trends, track performance, and identify areas for improvement.
They're especially useful for Sales Managers and teams looking to make data-driven decisions, understand what’s working well, and take action where needed.
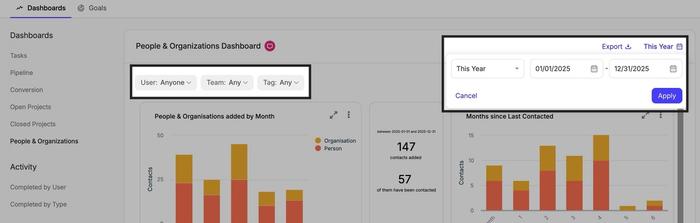
Filtering your Dashboards
Each dashboard allows you to apply filters to customize your view. The date filter applies across the entire dashboard, and you can also filter by User, Team, Pipeline, Tag, or Project Board - depending on the dashboard you're viewing. This makes it easier to focus on specific data points and gain more targeted insights.
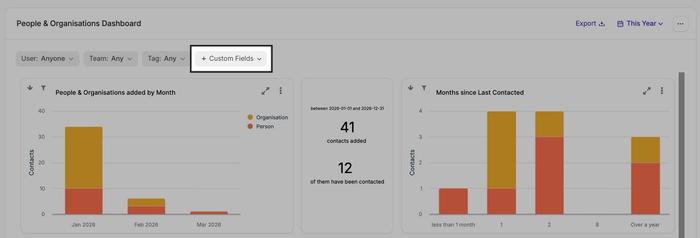
Filtering your Dashboards by Custom Fields
As well as the options above, you can also filter your Reporting Dashboards by Custom Fields - giving you more clarity and customization. To do this, choose the + Custom Fields button and select the Custom Field you want to filter by.
Custom Field filtering is available for the following Dashboards:
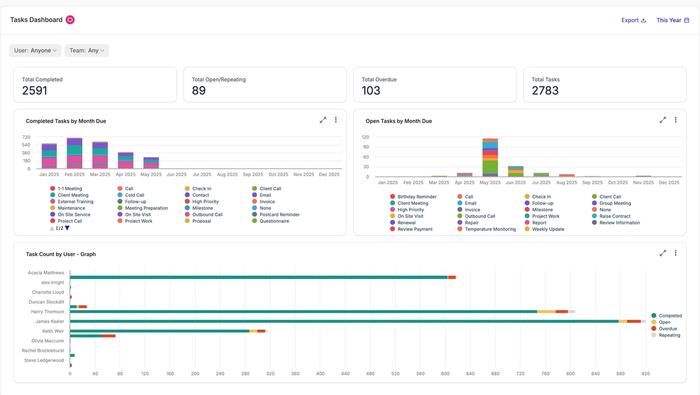
Task Dashboard
The Task Dashboard gives you a clear overview of how tasks are being managed across your team. It includes:
- Completed Tasks by Month Due – See how many tasks were completed and when they were originally due, helping you understand trends in task completion and whether deadlines are being met.
- Open Tasks by Month Due – Track upcoming and overdue tasks to spot potential bottlenecks or areas where support may be needed.
- Task Count by User – View how tasks are distributed across your team members, making it easier to balance workloads and monitor individual activity.
This dashboard is especially useful for keeping on top of team productivity, identifying potential delays, and ensuring tasks are evenly assigned and completed on time.
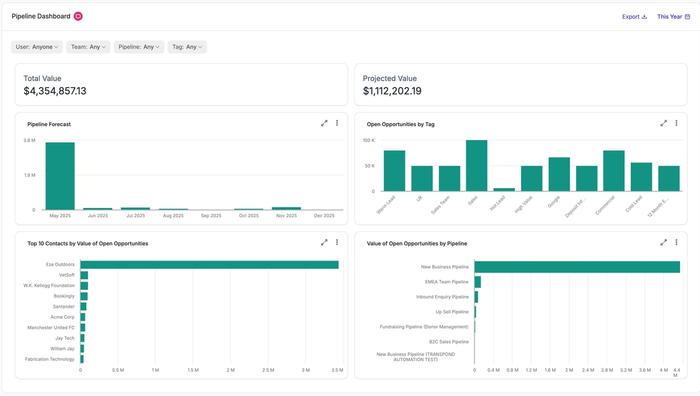
Pipeline Dashboard
The Pipeline Dashboard gives you a real-time view of all open Opportunities, helping you assess the health of your sales pipeline. It includes:
- Total Value – The total value of all open opportunities based on your selected date filter.
- Projected Value – A weighted value based on the likelihood of each opportunity closing, giving a more realistic forecast.
- Pipeline Forecast by Month – Visualize how potential revenue is expected to land over time.
- Open Opportunities by Tag – See how your opportunities are categorized, helping to spot trends or focus areas.
- Top 10 Contacts by Value of Open Opportunities – Identify your most valuable prospects or customers at a glance.
- Value of Open Opportunities by Pipeline – Understand how revenue is spread across your different sales pipelines.
This dashboard is especially useful for Sales Managers and teams looking to forecast revenue, prioritize high-value Opportunities, and ensure nothing slips through the cracks.
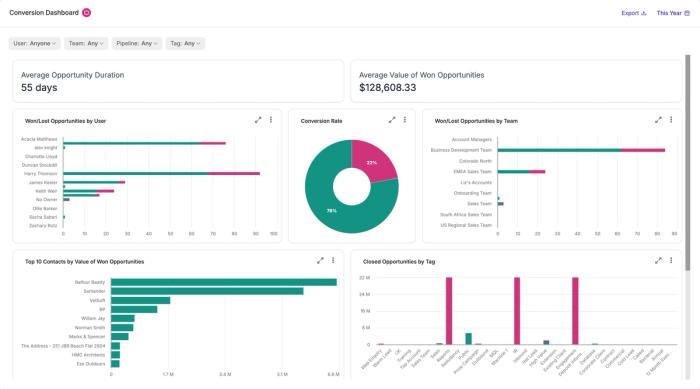
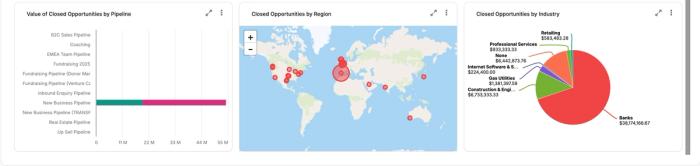
Conversion Dashboard
The Conversion Dashboard gives insights into all closed Opportunities - both won and lost - helping you evaluate sales performance and uncover areas for improvement. It includes key metrics such as:
- Average Opportunity Duration and Average Value of Won Opportunities
- Conversion Rate and breakdowns of Won/Lost Opportunities by User and Team
- Top 10 Contacts by Value of Won Opportunities
- Closed Opportunities by Tag, Pipeline, Region, and Industry (with region and industry data enriched automatically)
This dashboard is especially useful for understanding how long Opportunities take to close, who’s converting best, and which types of Opportunities bring the most value - helping teams refine their sales strategy and focus on what works.
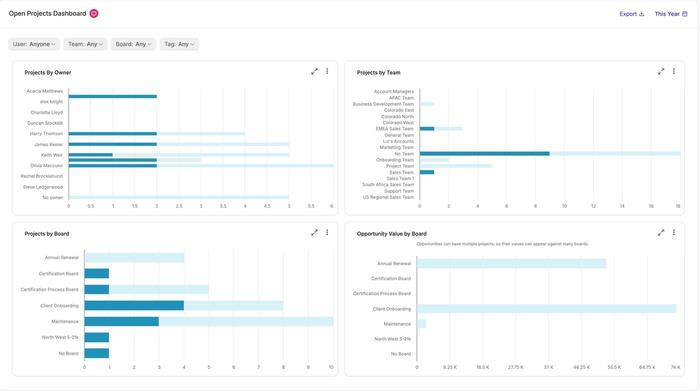
Open Projects
The Open Projects Dashboard introduces project reporting in Capsule for the first time, giving you visibility into all active projects across your team. It includes:
- Projects by Owner
- Projects by Team
- Projects by Board
- Opportunity Value by Board
This dashboard helps you track workload, monitor progress across boards, and see where the highest-value work is happening. It's a valuable tool for prioritising resources and managing project delivery more effectively - a great new addition to Capsule's features.
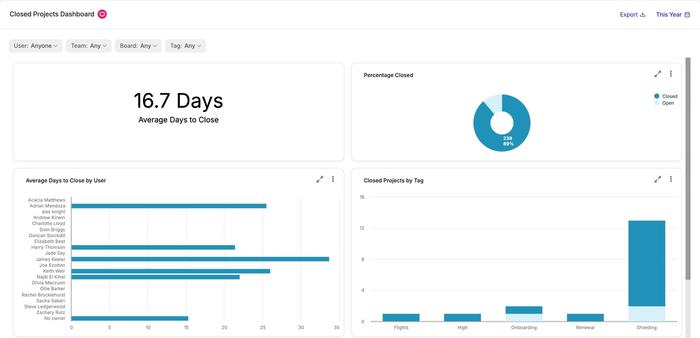
Closed Projects Dashboard
The Closed Projects Dashboard brings new visibility into completed Project work in Capsule. It helps you evaluate project performance and delivery trends with insights such as:
- Average Days to Close a Project
- Percentage of Projects Closed
- Average Time to Close by User
- Closed Projects by Tag
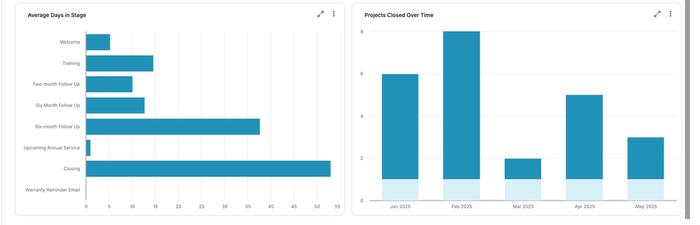
- Average Days in Stage
- Projects Closed Over Time
This dashboard is ideal for identifying how efficiently Projects are completed, spotting process bottlenecks, and understanding performance across users and tags - giving teams the data they need to improve project delivery moving forward.
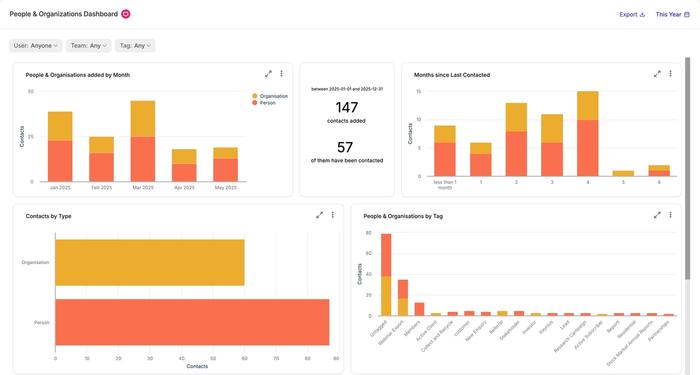
People & Organizations Dashboard
The People & Organizations Dashboard gives you valuable insights into your contact data and engagement trends. It includes:
- People & Organizations Added by Month
- Months Since Last Contacted
- Contacts by Type
- People & Organizations by Tag
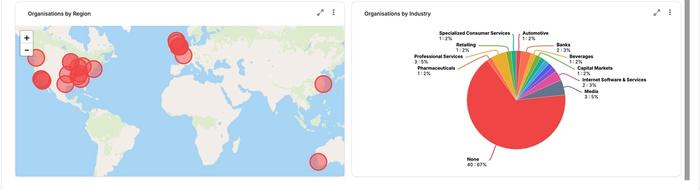
- Organizations by Region (from our enrichment)
- Organizations by Industry (from our enrichment)
This dashboard helps you understand how your contact base is growing, spot gaps in engagement, and identify trends across regions and industries - giving you a clearer picture of your network and where to focus your relationship-building efforts.
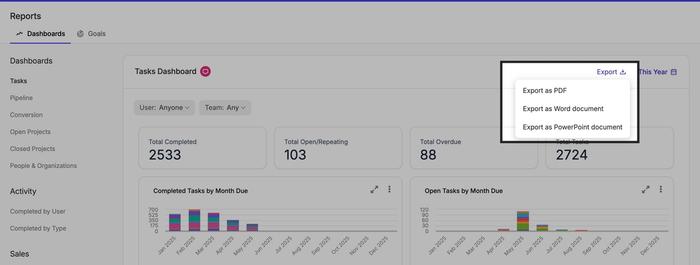
Exporting Dashboards
You can easily export your dashboards to share insights with your team or include them in reports. Choose to:
- Export the entire dashboard
- Export individual graphs or charts
Exports are available in PDF, Word, or PowerPoint formats, making it simple to present or document your data as needed.