You can manage your sales process in Capsule using Opportunities. The values you add for your Opportunities are then used to create a selection of really useful reports and forecasting tools which can help you understand what you’re doing right and where there’s room to improve. Here are some of the key benefits of using these reports:
- Identify why sales leads are lost. Use this to work out what’s causing friction for your customers at this stage and tweak your business process to improve this.
- Accurately forecast your revenue for the coming months. Avoid making costly business choices by knowing in advance how much revenue you are likely to generate.
- Find seasonal peaks and troughs in your revenue so you can better prepare for next year.
- Discover the average sales value for customers. Use this to help calculate your customers lifetime value and how much you can spend to acquire new customers.
Sales Dashboard
The Sales dashboard gives you some really useful insights into your Sales Pipeline. Here is an overview of the different reports available on your Sales dashboard.
Pipeline Forecast Dashboard
This report is used for predicting future revenue. This includes your Pipeline Value and Total Value. Use the sliders to change the date range to get a month-by-month forecast of monthly revenue.
the ability to drag the date range and expand the graph
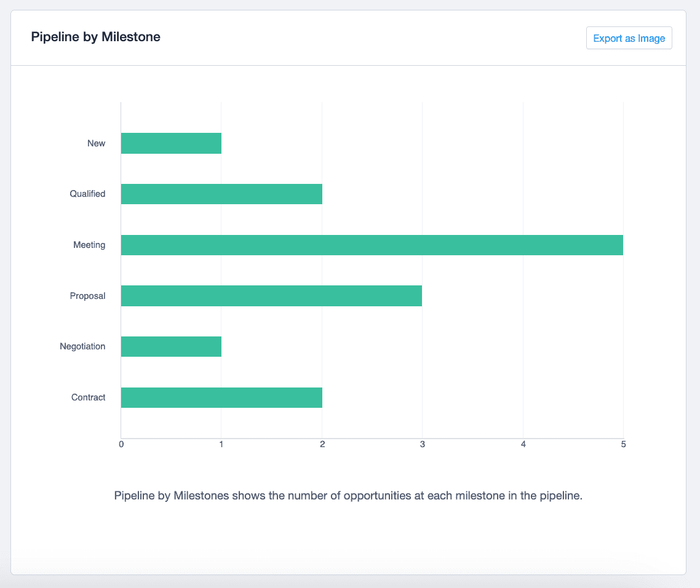
Pipeline by Milestone
A count of the number of Opportunities in each stage of your Milestone. This is useful to see if any stage of the Pipeline is getting clogged and you need to do some follow up with your contacts to move things along.
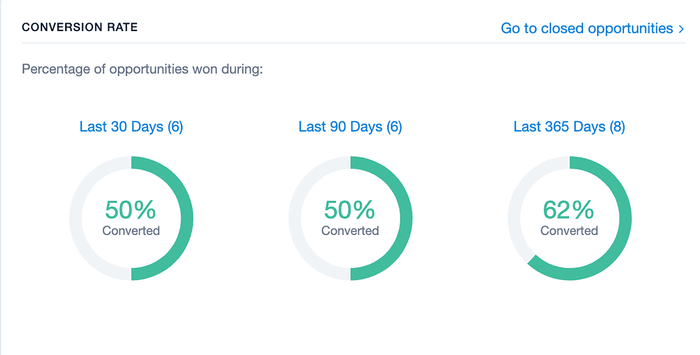
Conversion rate
An overview of what percentage of your Opportunities have been won in the last 30 days, 90 days and 365 days respectively. Hopefully your conversion rate should go up over time as you optimize your processes, so if you find your recent conversion rate dropping in this report, you can look into what is causing this.
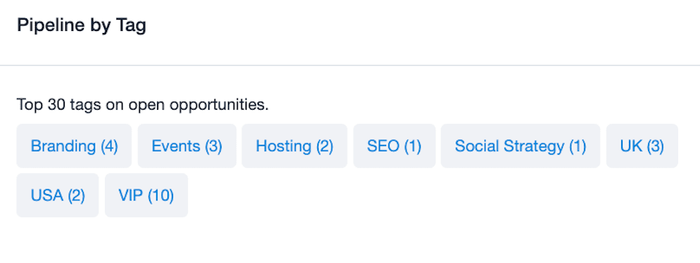
Pipeline by Tag
A list of Tags frequently used on your Opportunities with a count of how many Opportunities each Tag is used on. This shows you trends in your Opportunities and allows you to see areas that could be used for increasing revenue. You can click any Tag to view all Opportunities tagged with the respective Tag.
Pipeline Value vs Total Value
In your Sales pipeline, a couple of figures that you will see in a few different places are your Pipeline Value and Total Value.
Total Value - The sum of all of the Expected Values of Opportunities that are currently active.
Pipeline Value - Takes into account the Probability of winning each Opportunity to give you a more accurate prediction of your revenue when all Opportunities are closed.
Sales Reports
Knowing when and how much revenue you are generating can be crucial in helping you grow your business by understanding how your business ticks. At the most fundamental level, you want to know how much you have made in the past and where potential sales have been lost. This helps to prepare for the future.
Won/Lost Opportunities over Time
This report is perfect for this and gives you 6 key metrics that are going to be really useful in supercharging your sales planning:
- Won Count
- Won Value
- Won Percent
- Lost Count
- Lost Value
- Lost Percent
Use these metrics to understand peak times during the year and high value times where you can maybe adjust your workflow to optimize revenue for each period.
You can adjust the period you are looking at by using the buttons at the top of the page to switch between Weeks, Months and Quarters. You can also change what’s plotted on the graph between count and value.
demonstration of switching bar chart from month view to quarter view
Enhanced Sales Reports
On plans where you assign records and can group users into teams, Capsule offers an even deeper dive into your Sales figures by allowing you to breakdown stats by Owner and by Team. Allowing you to:
- Track individual performance
- Forecast sales
- Identify leaks in your pipeline
- Calculate your average sales value
demonstrating option to filter charts by team
How to get an overview of your Opportunities by User or Team
Won/Lost opportunities by Owner
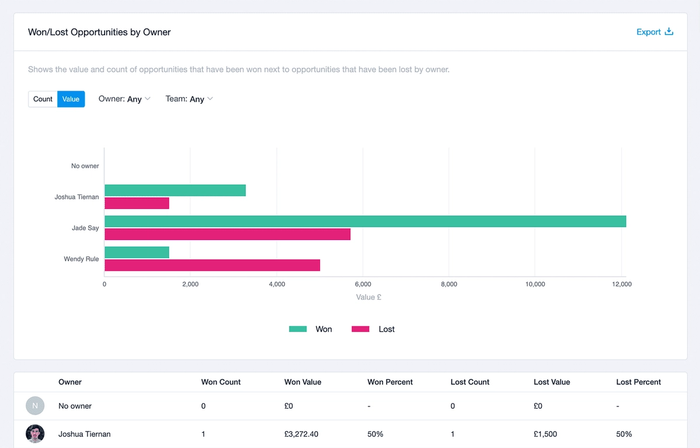
Similar to the Won/Lost Opportunities over Time report, this report provides a breakdown by Owner, rather than Week/Month/Quarter. This provides a birds-eye-view of what has been achieved by each team member.
Won/Lost opportunities by Team
Like the Won/Lost Opportunities by Owner report but gives you a breakdown by Team, rather than Owner.
How to report on your lost Opportunities
When you Lose an Opportunity, you can specify the reason why it was lost when closing it. We call these Lost Reasons. Lost Reasons are bespoke to your business and are setup by Account Admins. We have more information on this in our Lost Reasons article. The Lost Reasons are used to generate reports to help you identify trends on why your Opportunities are being lost. There are 3 reports available for reporting on your Lost reasons:
Lost opportunities by Reason
A breakdown of your Lost Reasons and the count or value of Opportunities being lost for each reason. Use this report to understand why you are losing customers - such as too high a price or a better offering from a competitor.
Lost opportunities by Owner
This report provides a breakdown by Owner to help identify if team members are not presenting your products/services correctly, which could be solved through training.
Lost opportunities by Team
Like the Lost opportunities by Owner report but gives you a breakdown by Team, rather than Owner.
Forecasting for your Business
As well as being able to look back on your closed Opportunities, it’s also important to look forward. This allows you to make sure that you’re on track with your sales targets. The forecasting reports in Capsule give you an accurate prediction of your future revenue based on the Opportunities that are currently in your pipeline. You can use this information to plan your cash flow and double-down on Sales in slow months. There are several forecasting reports available:
Pipeline Forecast
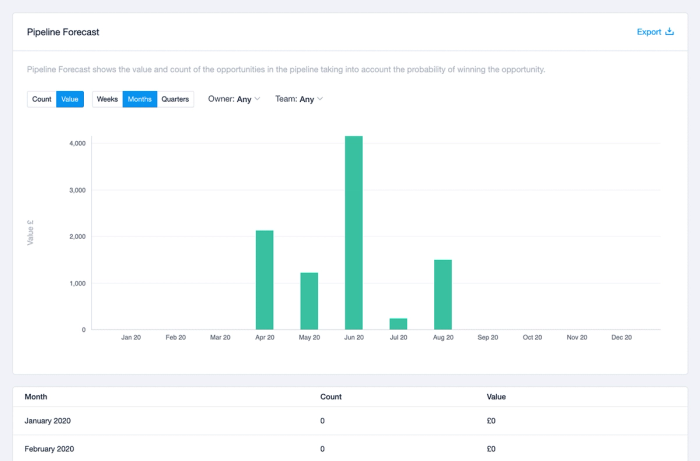
This report shows the value and count of the Opportunities in your sales pipeline, taking into account the probability of winning each Opportunity and breaks this down month-by-month. This is very useful to see when payments are expected to land in your account, helping you to plan cash flow effectively.
Pipeline by Owner
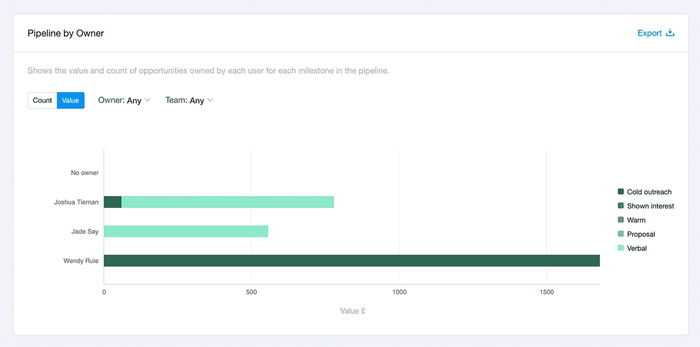
Shows the Pipeline Value of Opportunities owned by each User for each Milestone in your sales pipeline, taking into account the probability of winning each Opportunity. This is useful for knowing where your staff are with sales Opportunities, allowing you to follow up with them.
Pipeline by Team
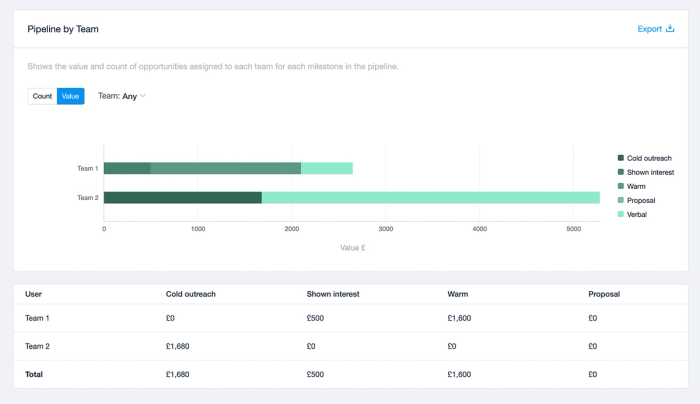
This report shows the Pipeline Value of Opportunities assigned to each Team for each Milestone in your sales pipeline, taking into account the probability of winning each Opportunity.
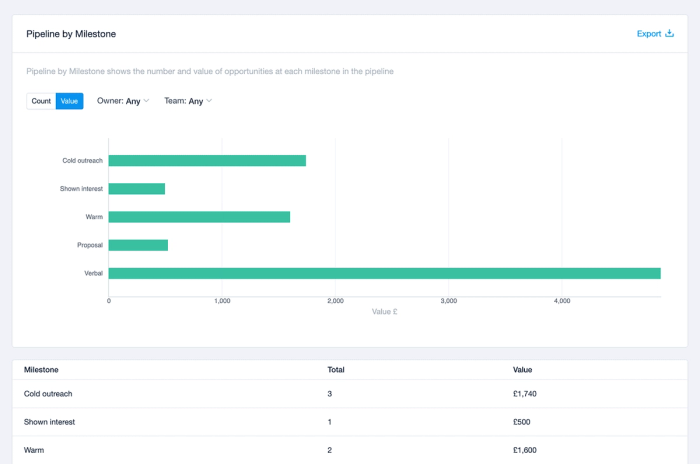
Pipeline by Milestone
Similar to the above reports, this shows the total number and Pipeline Value of Opportunities at each Milestone in your sales pipeline. Very useful for identifying when a Milestone in your pipeline is getting bottle-necked with too many Opportunities, or there is a lot of value sitting at a particular Milestone. Use this to iron-out friction points that are preventing your customers from converting.
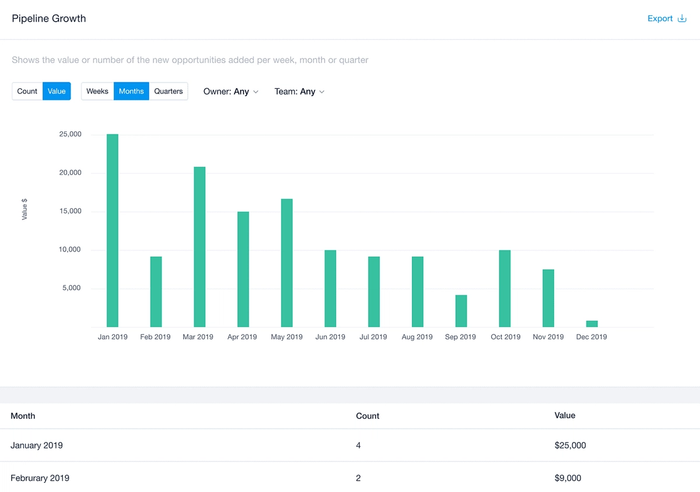
Pipeline Growth
Shows the value or number of the new Opportunities added per week, month or quarter. Find out when in the year you generate the most Opportunities to help navigate peaks and troughs in your calendar.
How to use Reports to predict future sales
As well as forecasting reports, we also have a couple of reports that will help you in predicting future sales values and timescales, allowing you to plan marketing spend and determine the lifetime value(LTV) of your customer base. These reports are:
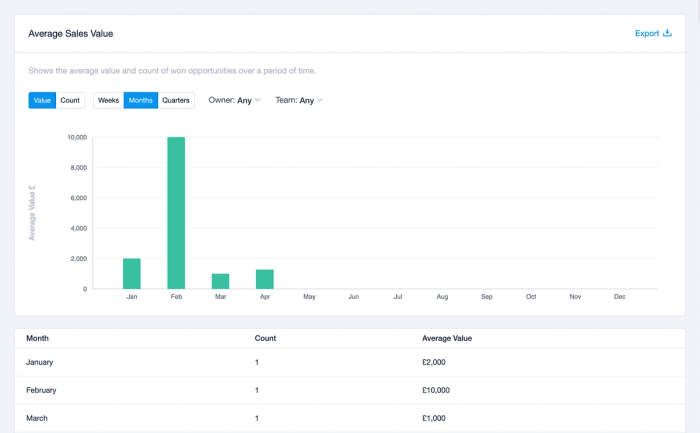
Average Sales Value
This report shows the average value and count of won Opportunities over a period of weeks, months or quarters. You can use the Total of the entire period to get your average sales value per year or discover why certain times of the year bring a lower or higher average sales value. Use these insights to weed out weak areas in your sales offering or to plan your marketing spend, ensuring a solid return on investment.
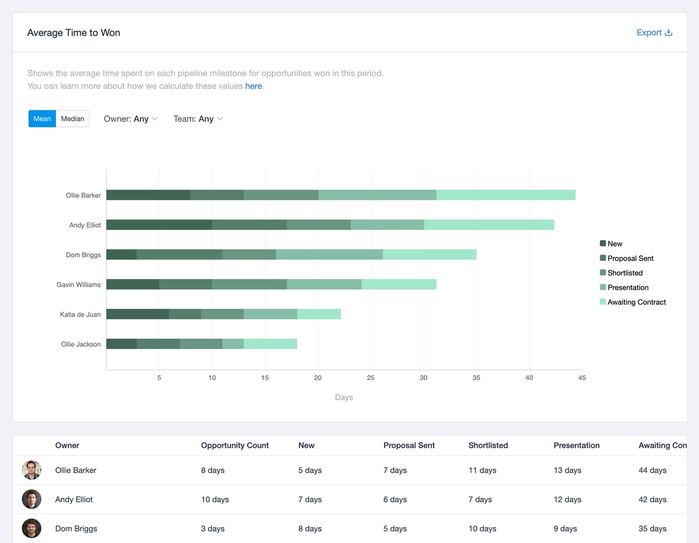
Average Time to Won
This report shows the average time Opportunities spend on each Milestone stage in your sales Pipeline. This includes only Opportunities which have been won in the period selected. Use this data to investigate what is causing the Pipeline to slow down at this stage and take action to streamline your processes. As well as providing a total for all users, it also gives you a breakdown per user which is useful for understanding problem areas if a user’s sales numbers drop.
The Average Time to Won report can be toggled to view either the Mean or Median average values.
- is the sum of the total number of days divided by the number of Opportunities.
- is the number found at the exact middle of the set of Opportunity values.
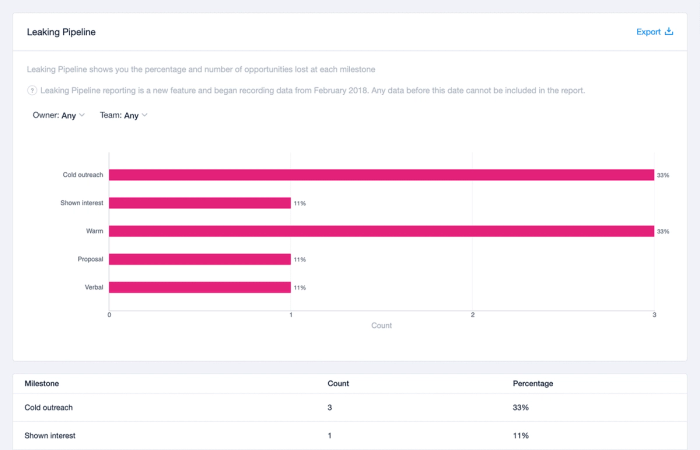
Leaking Pipeline
This report shows you the percentage and number of Opportunities being lost at each Milestone. By understanding where Opportunities are being lost, you can analyze your processes for that Milestone to establish what could be causing the drop-off in sales. Allowing you to take measures to fix this by streamlining your workflow or changing your process entirely.
